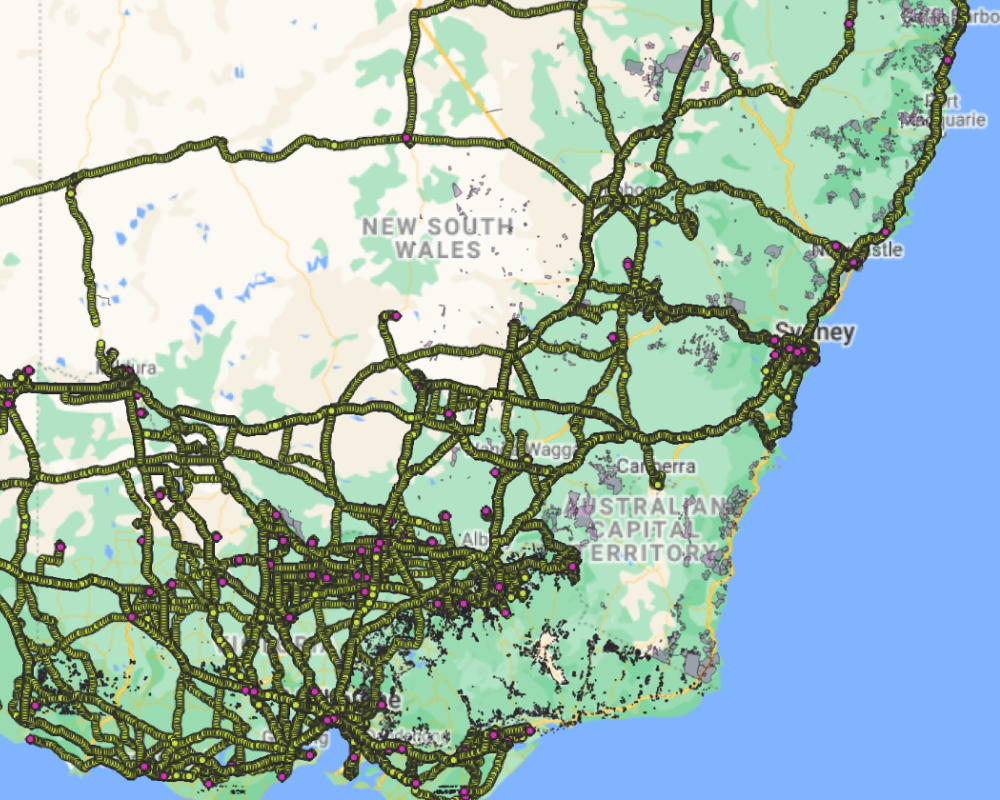
We've built position-level automated data integrations with over 20 telematics systems in use in Australia and have analysed bulk data extracts from many more. Working with telematics data, which comprises GPS positions with other attributes representing vehicle/asset state, presents a number of unique challenges that don't occur in other domains. In this article I provide a quick overview of one of our solutions to these, which we call the Parsimony data cleaner.
The problem
Our platforms ingest raw, or as close to raw as possible, position and state data recorded by telematics devices installed in commercial vehicles and other assets that operate in a wide variety of locations and environments. The raw data is generally very large, often millions or records per customer per month, and each telematics system has different internal processes that are applied to the data before it is made accessible to our platforms.
These factors mean that in addition to the types of errors inherent in all GPS data, many of the telematics systems we ingest data from produce unique error artefacts, including:
- occasional spurious (0,0) GPS coordinates
- occasional spurious GPS coordinates at manufacturer or distributor facilities
- a series of GPS coordinates reported at a fixed location over many hours, followed by a sudden leap to a distant location
- pairs of GPS coordinates with exactly the same timestamp but at different nearby locations
- occasional positions in a sequence that are inconsistent with the observed trajectory or are physically impossible
These errors, even if relatively rare, can distort trip measurements derived from positions. The telematics platforms may not capture these distortions as they can be difficult to identify with just one or two points causing significant distance or time changes at the trip level.
Our initial approach to this was to use filters for each specific case, but it quickly became apparent that this would be insufficient due to the variety of scenarios that can occur (often subtly different from similar cases) and the confluence of several factors having a combined effect that cannot be distilled to a linear rule definition.
It turns out to be quite complex to write heuristic code to robustly eliminate each of the different classes of errors. In some cases the bad data, considered in isolation, is indistinguishable from good data, other than by the fact that we can see that is not physically possible for one vehicle to have recorded both sets of data.
The solution
Conceptually, the cleaned data set should be the largest possible subset of the candidate point set that represents the feasible movement of a single vehicle. By enforcing limits on the possible speed and acceleration of a vehicle, we can eliminate the majority of obvious errors; sudden jumps, multiple points occupied at the same time or trajectories that are unrealistic. The strength of a global approach is that groups of points that, in isolation, look like good data but are located infeasibly far away from the surrounding points will also be rejected.
Lex parsimoniae, or Okham’s Razor, asserts that competing hypotheses should be settled by selecting the one that makes the fewest assumptions. We borrow the name from Okham’s Razor, on the basis that we are sifting through multiple hypothetical routes in search of the one that best fits the data without requiring any extraordinary assumptions.
The algorithm builds a list of point sets from the candidate set, such that each set contains only points that can be traversed in chronological order without violating the velocity and acceleration constraints. At completion, the largest subset is selected as the final cleaned point set.
A core challenge in this approach is keeping the computational complexity in check. Computing reachability between points requires a non-trivial geospatial distance calculation. The number of computations is highly correlated to the fragmentation (unreachable links) in the dataset. For a dataset which is entirely traversable (no bad data), we require only 𝑛-1 reachability tests. In the degenerative case where no two points are reachable, we require 𝑛(𝑛−1)/2 tests.
A key performance insight came from the realisation that it is only necessary to add p to the largest set in the list of traversable sets. Any other set that is also reachable from p will grow in subsequent iterations by exactly the same number of points, and can never grow larger than the currently largest set.
Thus we can greatly reduce the number of reachability tests by keeping the list of traversable sets in a list ordered by set size, and testing reachability from largest to smallest set. We can stop testing for p as soon as p is added to the first reachable set.
Examples
To illustrate the effect of the Parsimony cleaner, let's look at a few examples of pre and post application data from two sample trips displaying some of the common error classes. Note that these examples were chosen to illustrate the effects of these errors and are as such, are examples of unusually poor data. Most trips show lower rates of erroneous points so the effects are more subtle.
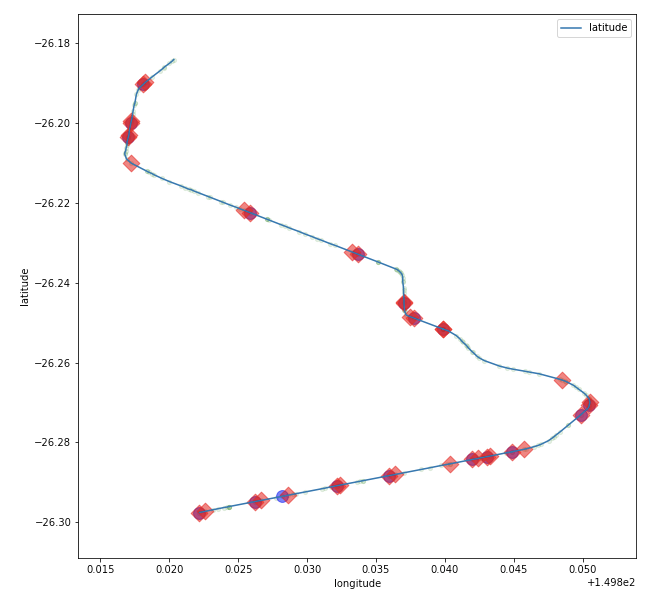
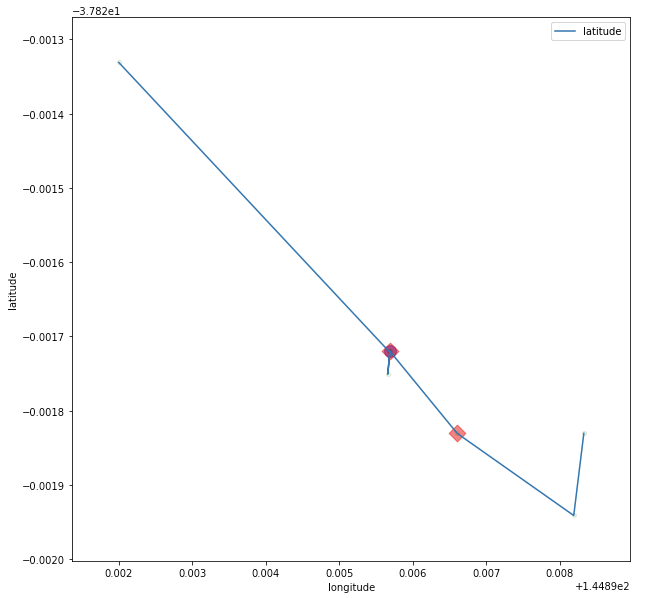
In the first example below, the raw trip data from a Western Star prime mover shows a reasonable trajectory that may not raise any concerns upon visual inspection (e.g. looking at the points on map). However, within the raw data there are points of concern. The red diamonds are points with an acceleration greater than 10 m/s². For reference, most trucks typically accelerate at around 1 m/s², 10 m/s² is beyond super-car performance! There are also a few points with velocity over 150 km/h, the purple circles, which is beyond the achievable top speed of this vehicle.
Figure 1 - Pre-cleaning point sequence
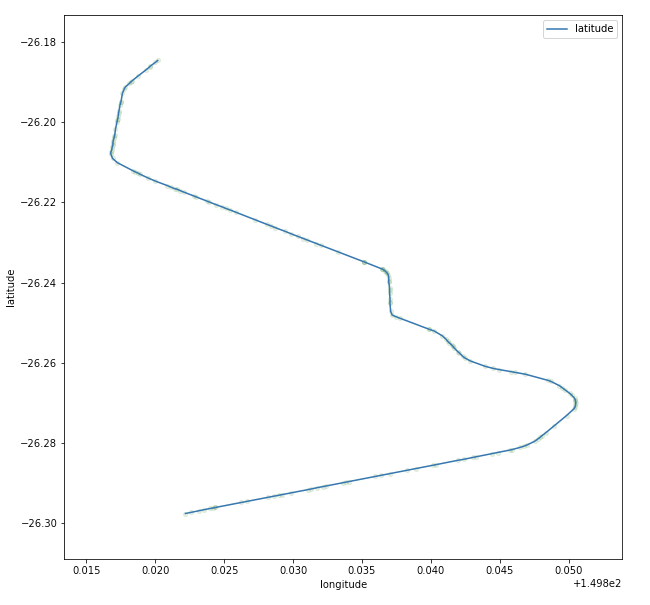
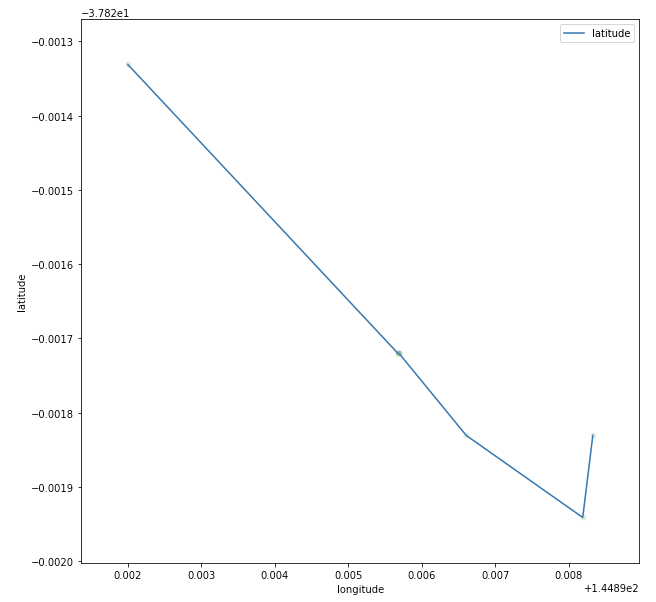
Following application of the Parsimony algorithm, the trajectory remains intact but all points exceeding realistic activity measurements have been dropped, a total of 359 points out of the 2,856 in the trip or 12.5% of the total number of points provided by the telematics system. The trip distance and time calculated from the point data was reduced by less than 0.5%.
Figure 2 - Post-cleaning point sequence
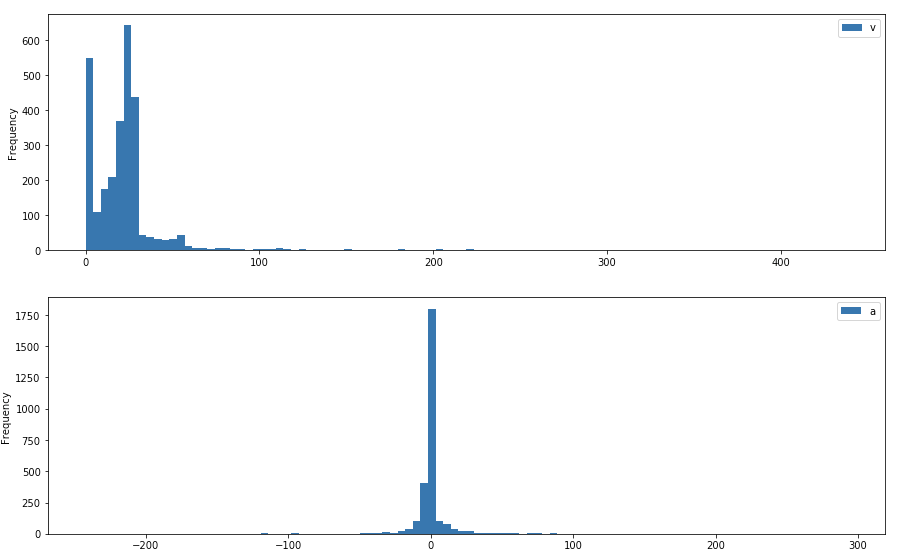
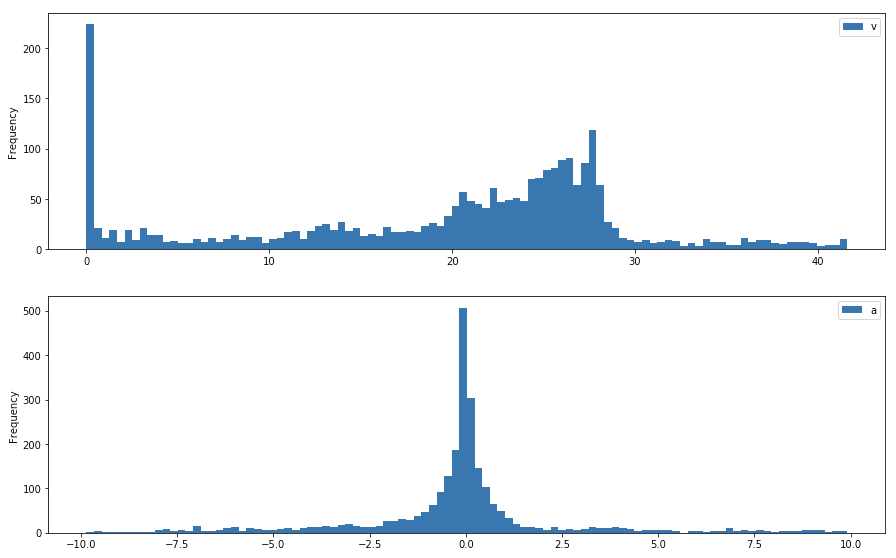
The charts below show the change observed in the distribution of velocity and acceleration for the set of points that comprise the trip. The pre-cleaning distribution shows a long right tail on the velocity chart and long tails on both sides for acceleration.
Figure 3 - Pre-cleaning velocity and acceleration profile
After cleaning, both carts show a large reduction in kurtosis and values within realistic ranges on both scales.
Figure 3 - Post-cleaning velocity and acceleration profile
Our second example shows a rapid deviation of the vehicle from it's trajectory which is caused by a few positions out of line with the rest of the sequence. This can happen when a device can't obtain a high-precision position fix (such as when in a valley and has line of sight to less than the required number of GPS satellites) or due to errors occurring in the data transmission or transformation processes that form part of the telematics system pipelines. We can't tell what the cause is, but we can clearly see that the trajectory is not realistic by the acceleration which in this case was over 100 m/s².
Figure 5 - Pre-cleaning point sequence
Following Parsimony cleaning, the unrealistic diversion has been removed from the trajectory without affecting the other points and we can now calculate accurate trip measurements.
Figure 6 - Post-cleaning point sequence
Summary
The Parsimony algorithm has been a valuable tool to ensure that the GPS data we're using to calculate important measurements supporting operational and financial decisions is as error-free and representative of actual vehicle usage as possible.
By using an algorithm that is adaptive to various error types and considers the sequence of positions together, rather than evaluating individual points in isolation, we achieve broader error capture and greater consistency across data sets from different source systems.
If you'd like to know more about this or other tools we use in our platforms, feel free to get in touch.